June 23, 2015 | Chris Klotzbach
There is no denying that Asia is the linchpin of the mobile revolution - designing and manufacturing our devices and publishing some of the world’s most popular apps. Long gone are the days when we look East for only parts and labor, as markets in Asia have developed massive consumer bases and a app developer community to serve them.
As we first reported back in 2013, China surpassed the U.S. to become the world’s largest smart device market. Last year, we chronicled how Xiaomi was bringing some of Apple’s magic to Android. In Flurry’s latest report, we take a closer at Asia, a region where Flurry Analytics is now tracking 610 million monthly active devices, or approximately one-third of the 1.8 billion devices we see monthly. This study examines how app users in the top 30 Asian countries differ from the rest of world, where they are driving growth and how that growth is impacting smartphone use.
The Mobile Revolution Continues in Asia
Between 2014 and 2015, Asia experienced double digit growth within its mobile app economy. When we compared total session growth in the trailing 12 months from April 2014 to the trailing 12 months from April 2015, we found that sessions in Asia grew 77 percent. The double-digit growth in the region - off an already large base - is astounding. What’s even more interesting is it is driven by consumer categories that provide a clue about the growing purchasing power and sophistication in the region. Three categories of apps stand out as driving this growth– Shopping & Lifestyle, News & Reading and Utilities and Productivity.
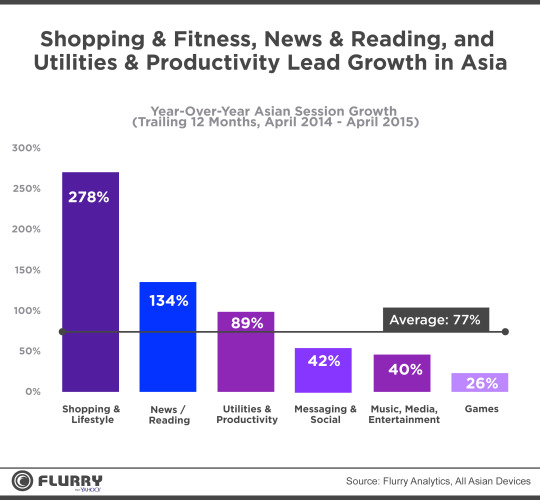
Messaging & Social
Messaging & Social and Games categories are continuing to show growth, but at a decelerated rate in comparison to their historic trends. This is reflective of the maturation and lifecycle of those categories. With that said, the growth of Shopping, News and Productivity apps and relative lag in growth in gaming and social indicates that users in Asia have started to adapt their app usage for purposes beyond the traditional gaming and entertainment functions.
Mobile Shopping
Digging into the the growth of mobile shopping throughout Asia, it’s important to recognize that the region is very large and diverse and shopping trends differ by country. For example, we see that shoppers in Singapore prefer traditional e-commerce and brick and mortar locations, whereas in India, online shopping destinations, such as Myntra, are shutting down their websites in favor of an app-only strategy. Although the shift from e-commerce to m-commerce has not occurred everywhere in Asia, we are still seeing staggering growth across the region in terms of engagement.
So when are users in Asia shopping in apps?
A Continent of Shopaholics
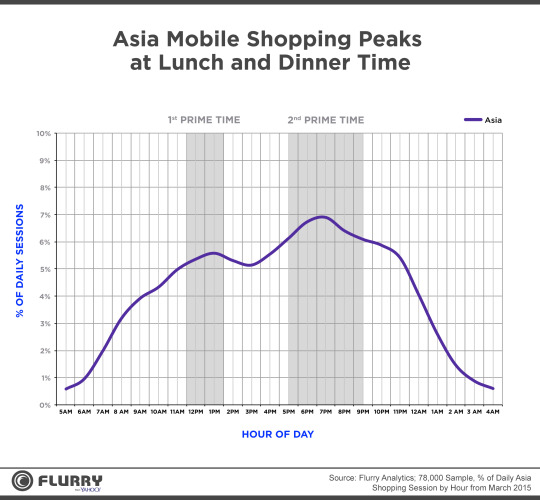
When we examined the shopping patterns of smart device users in Asia, it became clear that any time is a fine time for shopping on your phone. Mobile shopping peaks first during the lunch hour, between 12pm-1pm, and then again during dinner time between 6pm and 8pm. Though looking at the data in aggregate, it appears that shoppers in Asia are heavily engaged from 5am until 10pm everyday! It looks like the tradition of the night (and morning, and afternoon) market has translated into the app experience in Asia.
Asia is Leading the Phablet Revolution
As previously published by Flurry from Yahoo, we’ve recognized the phablet as the fastest growing device type to date, with 148 percent year over year growth worldwide (The phablet: Third stage media booster rocket). After looking at session percentage by form factor in Asia, it is clear that Asia is a large contributor to the growth of the phablet device. Globally, session distribution between medium phone and phablet is 60 percent and 31 percent, respectively. In Asia, sessions are split evenly between the devices, with medium phones contributing 45 percent and phablets 42 percent.
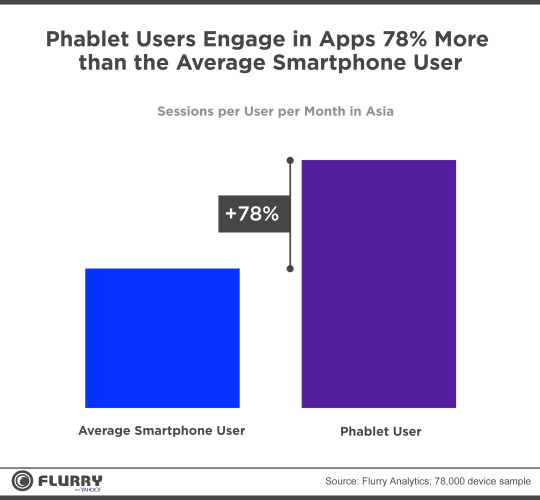
What’s particularly exciting for app developers in Asia is that we’ve found that phablet users in Asia conduct 78 percent more sessions than the average smartphone user. As more users in the region adopt phablets, we should expect app growth to continue and perhaps, accelerate.
Asia App Usage: Diverse and Engaged
Although we continue to see growth and user engagement in traditional app categories like Messaging & Social and Gaming, users in Asia demonstrated that in 2015, they are utilizing their smartphones and apps for more functional and practical purposes. This is indicated in the growth in the Shopping & Lifestyle and Utilities & Productivity app categories. Asia is the home of the phablet, and we see users have embraced this form factor- not only in terms of installed base but actual app usage. Just as the rest of the world is beginning to catch on to the phablet, only time will tell if we’ll catch up to Asia’s propensity to be productive and shop!
Games, Lifestyle & Shopping and Utilities & Productivity dominate Time Spent
One quarter of the mobile app time spent by users in Asia is in games. The next largest category is Lifestyle and Shopping, with 19 percent of total time and coming in third is utilities and productivity with 17% of users time spent. Utilities and Productivity demands 40 percent more time spent in Asia than it does of users in the United States. Although messaging is a large driver of sessions in Asia and around the world, it only represents 13 percent of users time spent in their mobile apps.
Compared to the rest of the world, Asia is a unique app market.
Through analysis on engagement by gender, we’ve found that Asia is a unique market when compared to the rest of the world, specifically for the Photography, Lifestyle & Shopping, and Personalization categories.
Although 81 percent of Asia’s photography app users are female, men in Asia are 1.9x more likely to use photography apps than men in the rest of the world. With Life & Shopping, women in Asia dominate the category in terms of use, but are also 1.4x more likely to shop in mobile apps as compared to women around the rest of the world. Globally, 81% of personalization app users are men, though in Asia, usage is split evenly between men and women, 51 percent and 49 percent respectively. This makes women in Asia 2.7x more likely than the global female population to use personalization apps. This is likely due to prevalence of Android devices in the region.