The week between Christmas Day and New Year’s Day in the United States is the most prolific for device activations, app downloads and app usage. A wave of new devices flood the market as phones are given as gifts during the holiday season, followed by consumers loading them up with apps.
Christmas has become a battleground for Apple and Samsung, each fighting to capture share in an increasingly saturated market. On Christmas Day 2019, Apple came out on top, with this year’s iPhone 11 taking the top spot and Apple owning nine of the ten most activated devices.
For this report, we’ll analyze device activations from December 25 - December 31, 2019 to ascertain whether Apple continued its Christmas Day momentum through the final week of the year, up through New Year’s Day. Flurry Analytics, part of Verizon Media, is used by over 1 million mobile apps, providing aggregated insights across more than 2 billion active mobile devices per month. Let’s see what happened.
Apple Gains While Samsung Drops
Compared to December’s pre-Christmas level of activations, Apple captured significantly elevated market share between Christmas and New Year’s. Led by strong adoption of the iPhone 11 and iPhone XR, this is helping Apple reverse a slow, but consistent trend of market share erosion in the United Stares at the hand of Samsung.
During the last week of 2019, Apple captured market share at a rate of two percentage points higher than its pre-Christmas levels, while Samsung dropped by nearly three percentage points – for a net change of five percentage points between the two companies. For device manufacturers of this scale, and during the highest device adoption period of the year, these are critical shifts.

iPhone 11 Maintains Top Spot
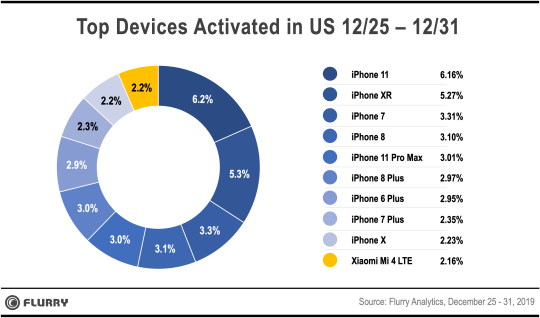
Apple’s iPhone 11—this year’s lowest end model of the 11, 11 Pro, and 11 Pro Max trifecta—continues to dominate the smartphone landscape, representing 15.4% of all new Apple devices activated and 6.16% of all smartphones activated between Christmas and New Year’s Eve. Apple’s 2018 iPhone XR, which was the dominant device leading up to Christmas Day in 2019, comes in at a close second with 13.2% of all Apple devices and 5.27% of all smartphones. In fact, Apple’s older generation devices continue getting traction, likely appealing to more price sensitive customers. iPhones 6, 7 and 8 all cracked the Top 10 list.
Samsung’s Post Christmas Drop
While our earlier analysis showed that Samsung was the one non-Apple device to crack the Top 10 on Christmas Day, the Galaxy A10e fell off the list to number eleven, post-Christmas. Apple still holds nine of the ten spots, with Xiaomi’s Mi 4 LTE moving into the number ten spot.
Apple Drives Holiday Device Activations
The final chart, shown below, plots the market share earned by Apple and Samsung each day from December 1 - December 31, 2019. Take a look, and then let us walk you through it.
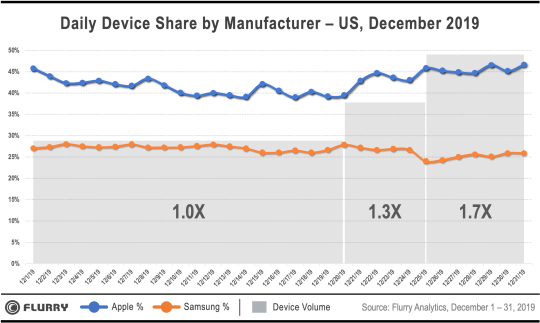
Apple’s daily captured market share is represented by the blue segment line and Samsung’s by the orange segment line. Overlayed in the chart for reference, we also highlight three distinct periods of the month in gray: December 1-20, December 21-24 and December 25-31.
- Baseline: The first section, December 1-20, can be considered a baseline. We took the average daily device activations and set them to “1.” New device activations during this period were relatively steady.
- Ramp to Christmas: The second period, from December 21-24, is the ramp to Christmas during which device activations begin to climb. On average, this period saw new device activations at 1.3 times the baseline rate.
- Holiday Week: Finally, the third section is the Christmas to New Year’s week, from 12/25 - 12/31. This is by far the highest activation period of the year, and 1.7 times greater than the December baseline rate. Christmas Day, alone, is the highest new device activation day of the year, at 2.2 times the baseline rate.
Inspecting the chart, we notice a few key trends. First, Apple is earning between 39% - 47% of new device activations across December, and their share climbs as the month progresses. This averages out to 43% for the month, which holds Apple around the market share rate we calculated just before the holiday season. Meanwhile Samsung earned between 24% - 28% across December, delivering a total December share of 26.5%. This is lower than the approximately 30% U.S. market share we calculated for Samsung ahead of the holidays.
We believe that Apple’s performance over the holidays is helped by its annual device release strategy each Fall, where they build up demand ahead of the holidays and align with gift purchasing behavior in the United States. In particular, the combination of the new 2019 iPhone 11 and the 2018 iPhone XR, which continues to sell strongly during the 2019 holiday season, drove high volume for Apple.
Happy New Year!
Happy New Year from all of us at Flurry. We look forward to sharing more app economy insights over 2020 and wish everyone a happy, healthy, successful 2020.
Apple and iPhone are trademarks of Apple Inc., registered in the U.S. and other countries. Samsung is a trademark of Samsung Electronics Co., Ltd in the United States and other countries.